The Power Law, Tested
The claim, stated without the chart
The bitcoin power law fits price to time: 10-17.016 multiplied by the number of days since 3 January 2009, raised to the power of 5.845. Plotted in log-log space it is a straight line. On that line, fair value is $181,441 today and $489,368 at the end of December 2029.
Two things follow. First, $500,000 by 2029 is not an extreme reading of this model — it is the central one, arriving a month past the year end on the fit itself. Second, the model's own channel is roughly 10x wide: support at $64,622, resistance at $632,075. A model whose band contains almost any imaginable outcome cannot be falsified by the passage of time, which is the honest reason it has outlived the versions of this argument that could be.
So we re-estimated it on our own data before using it. On 4,376 daily closes the exponent comes out at 5.803 against the published 5.845, with a constant within 14% of the published one. It is the same line, and it is not hand-drawn to a target.
What we tested
Anchor: $86,550.76, the 21 September 2026 20:00 UTC snapshot. Horizon: 1,197 days to 31 December 2029. Paths: 100,000, simulated in chunks. Volatility comes from our own closes — 46.9% annualised over 3 years, 67.1% over 10 years.
The deviation series matters more than the line for what follows: price against the fit, measured daily, has a mean of −0.221 in log terms and a standard deviation of 0.545, with a daily autoregressive coefficient of 0.99781. That implies a half-life of 315 days for any gap to the line.
Five scenarios, and we keep them apart deliberately. A no-view random walk, where the expected value equals today's price. A block bootstrap of de-meaned returns, which keeps the empirical tails without smuggling in a trend. The same bootstrap with the last 12 years of drift left in — labelled for what it is, which is not a forecast. The fit's own growth rate with no catch-up. And the fit with the deviation reverting at its measured half-life.
The results
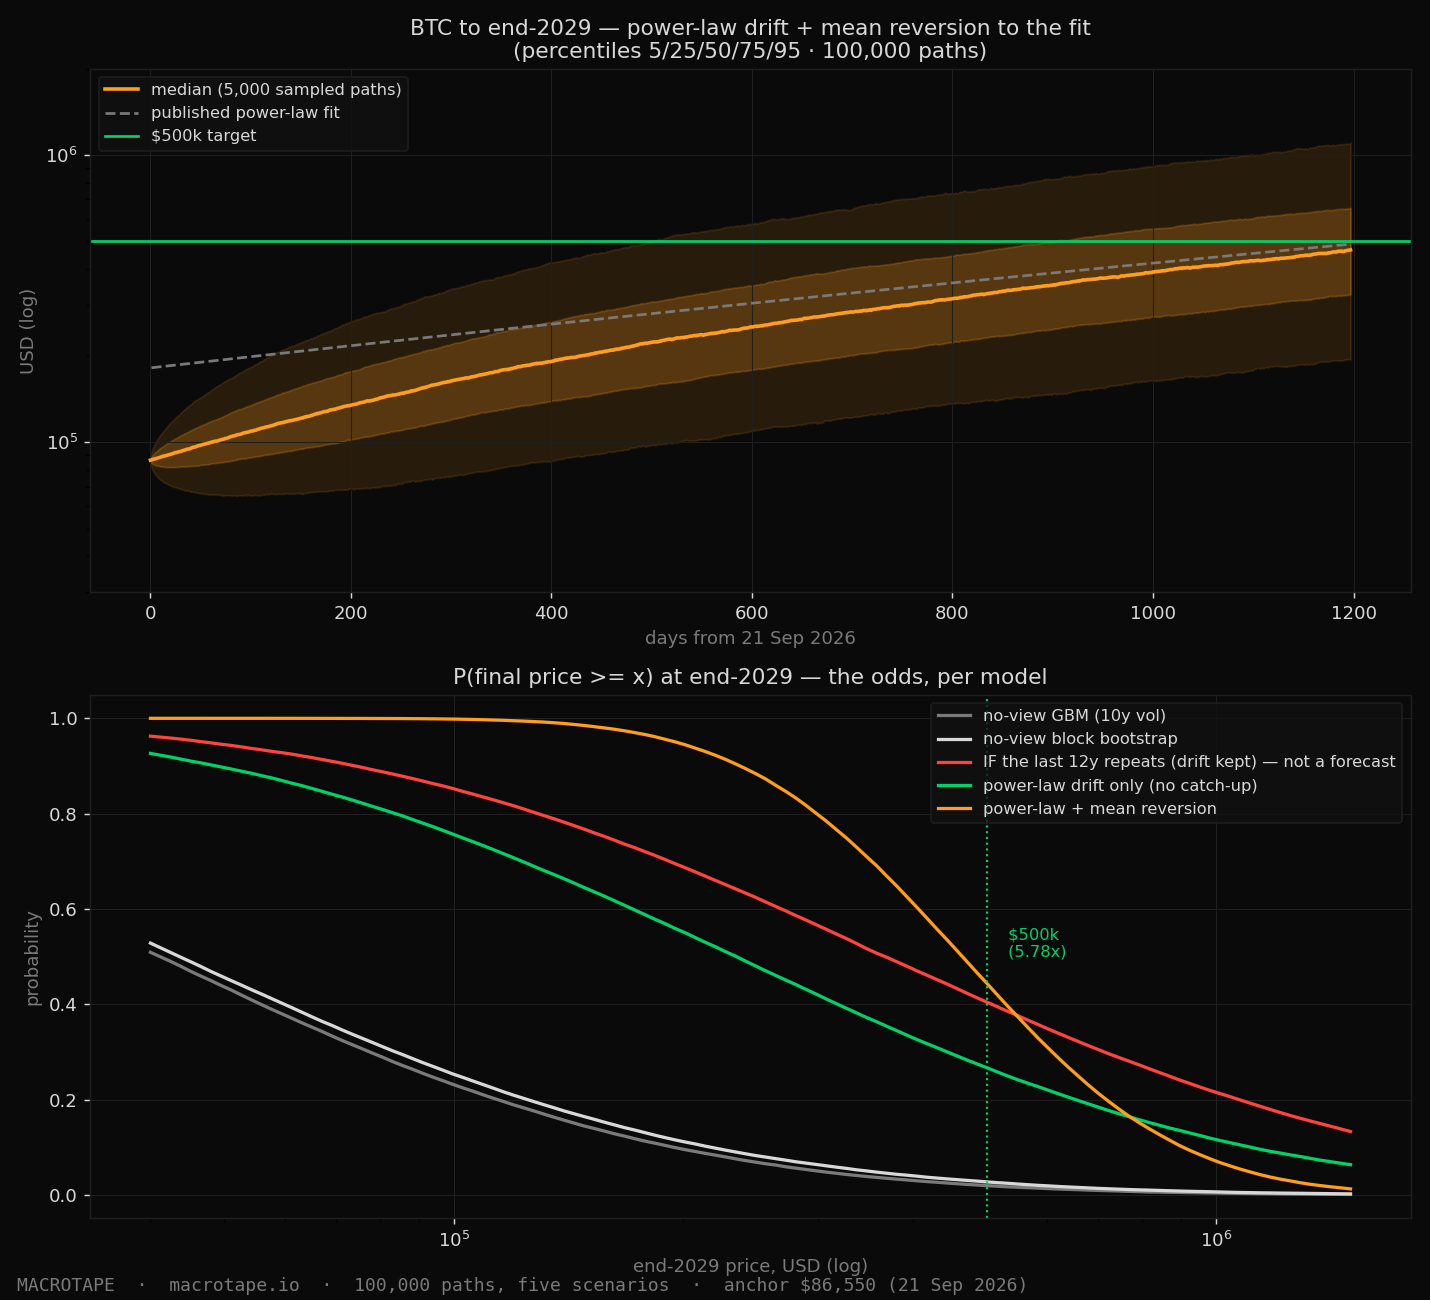
- No-view, 3yr volatility: median 0.70x. Probability of touching $500,000: 1.5%. 66% of paths finish lower.
- No-view, 10yr volatility: median 0.48x. Probability of touching $500,000: 5.3%. 73% finish lower.
- No-view, block bootstrap: median 0.50x. Probability of touching: 6.8%.
- Trend kept, last 12 years repeat: median 4.25x, 52.6% touch probability. This is the variant that manufactures bullish headlines, and it is in the chart only to be seen for what it is.
- Power-law drift only, no catch-up: median 2.72x. Touching $500,000: 38.9%. Ending above it: 26.8%.
- Power-law plus mean reversion: median 5.37x. Touching $500,000: 74.5%. Ending above it: 44.5%.
The hinge is the deviation, not the trend
Follow the fit's own growth rate — n/t, about 33% a year and decaying from there — and the median outcome lands near $235,000, not $465,000. The entire difference between the last two scenarios is one assumption: whether a 52.3% discount to the line gets bought.
That is a checkable thing rather than a matter of belief. The gap has closed in every cycle in our sample, at a measured half-life of 315 days. If it closes again, the fit's central case is roughly $465,000 by the end of 2029 and $500,000 is live. If the gap is still wide open in 12 to 18 months while the line keeps climbing, the model is breaking rather than offering a discount — and that, not the price, is the falsifier we will hold it to.
Note what the no-view runs say, because they are the honest control: with no drift at all, $500,000 is a 1.5% to 6.8% event and the median path finishes lower. That is not a bearish view. It is what a random walk looks like at 67% annualised volatility.
Why this belongs next to the treasury work
Everything above is an asset-price exercise. The corporate treasury complex runs on the same asset with a cash coupon attached, so its constraint is different: not the level of the line, but whether the paper keeps clearing at par to fund the next purchase. The support level of $64,622 is the region where those two questions meet.
We set out the structure of that funding in lesson 05 — five preferred series, one queue, and a variable-rate leg whose coupon, not whose price, carries the volatility. Read the two together and the bitcoin question stops being a price target and becomes a question about the cost of the next dollar of funding.
How we will run this
This is the first piece in a running series. The fit, the deviation and the Monte Carlo re-run, published at each quarter end with the parameters attached, so the record is checkable rather than remembered. The chart above is regenerated from the same script that produced these numbers, which is why it carries the anchor date it does.
Rates & Duration — the discount rate the same thesis is priced against