The Gap That Did Not Close
Fiscal dominance describes a government whose borrowing need sets the ceiling on what its central bank can do, rather than the reverse. The market for its bonds sets the price of that borrowing. When the market will not pay the price, three exits remain: raise rates, spend reserves, or print.
Lawrence Lepard, an investment manager at Equity Management Associates and the author of “The Big Print”, argues the third exit is now arithmetic rather than choice. He plots the growth of US debt against the money the Federal Reserve has created and finds the first outrunning the second. Luke Gromen, of Forest for the Trees, gives the same read a mechanism: austerity now would force the deficit past its wartime peak and leave the Federal Reserve as the only buyer.
The claim this piece tests is not whether the debt is large. Both men are right that it is. The claim is whether the size of the money base decides whether the debt can be carried, or whether something else does — and whether that something is observably under strain today.
The claim, and the chart
Lepard published the chart on 8 October. A red line tracks US debt past $120 trillion. A blue line tracks the Federal Reserve’s balance sheet near $6.7 trillion. Three labels mark the money-creation episodes he calls Big Print I, in 2008, Big Print II, in 2020, and a projected Big Print III.
His caption is the thesis in a sentence. Base money must expand to support the growth in debt, or the debt collapses. He adds: it is just math.
The red line is all-sectors debt, which counts government, households and businesses together — roughly $120 trillion. The measure used here is the federal government’s own debt, $39.46 trillion on 30 June 2026, because the fiscal-dominance question is about the sovereign’s paper and the buyer of it. The two move in the same direction.
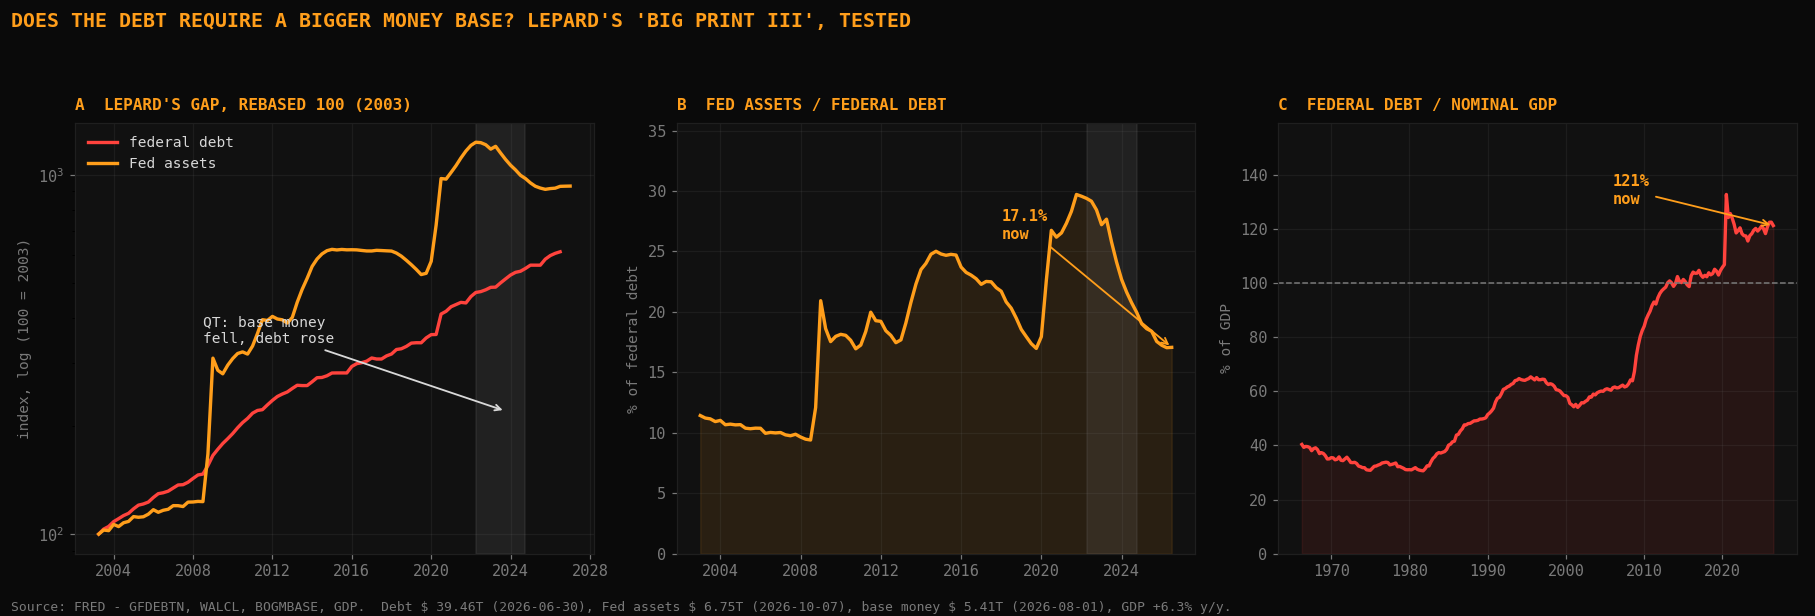
The gap did not close for 3 years
Between April 2022 and September 2024 the Federal Reserve shrank its balance sheet while federal debt kept climbing. Fed assets fell to $7.08 trillion from $8.91 trillion. Federal debt rose to $35.46 trillion from $30.57 trillion. The ratio of the first to the second went to 20.0% from 29.2%.
Base money behaved the same way. It contracted through the same window, to $5.41 trillion on 1 August 2026, on the Fed’s own release.
If the debt required a growing money base to be carried, the tightening years were the test, and the debt was carried through them anyway. A gap that widens for 3 years without producing the event it is supposed to force is not yet a mechanism. It is a gap.
What has to grow
Debt is not redeemed in base money. It is rolled, and the rolling is intermediated by banks, money-market funds and foreign official accounts, which hold the paper as an asset against their own liabilities. The cash to settle a maturing bond comes from the sale of a new one, not from the printing press.
What has to grow for a debt to stay serviceable is nominal income, and the tax base resting on it, against the rate the debt pays. When nominal GDP grows faster than the average interest rate, the ratio of debt to income falls without any austerity at all. Nominal GDP grew 6.31% over the year to 30 June 2026, on the Bureau of Economic Analysis accounts. Federal debt is 121% of it.
The binding test is whether the payment on the debt crowds out everything else. On the most recent reading, interest ran at a $1.25 trillion annual rate against federal receipts of $5.98 trillion, both seasonally adjusted — 20.9% of everything the government takes in. That is the number that matters. It is large, and it is not yet terminal.
The strongest version of the case
Gromen supplies the mechanism Lepard’s chart leaves out, and it is worth stating at full length because it is the strongest form the argument takes. An attempt at austerity, he writes in a post on 8 October, would trigger a recession rather than a repair.
The last three US recessions lifted the deficit by 600 to 1000 basis points of GDP, by his count, which would place it at 13% to 17%. A stronger dollar would then force holders of the roughly $13 trillion to $14 trillion of dollar-denominated debt owed abroad to sell, in his estimate, adding $1 trillion to $2 trillion, or 4% to 7% of GDP, to the effective deficit.
That puts the total at 17% to 25% of GDP, larger than the wartime peak, arriving in a recession where the private sector is de-grossing rather than saving. The only buyer left is the central bank, and the alternative to printing is a spike in rates that would impair the collateral underpinning the banking system. The United States ran a deficit of 5.77% of GDP in 2025, a year without a recession, on the fiscal accounts.
Where the chain breaks
The 600 to 1000 basis points is a policy response, not a physical constant. Those deficits were chosen: stimulus, bailouts and automatic stabilisers dialled to their maximum in 2008 and in 2020. A bond market that knows the response is discretionary can also price a smaller one.
The dollar leg points the wrong way for the conclusion. A stronger dollar raises the local-currency return on dollar assets, which is ordinarily a bid for Treasuries rather than a reason to sell them. It also cannot do both jobs the argument needs. A stronger dollar forces the selling; a weaker one produces the debasement. Both cannot be the same episode.
The binary of printing or collapse skips the middle where the system actually operates. Yield-curve capping, capital rules that force banks to hold government paper, and financial repression through the regulated balance sheet are all mechanisms of monetisation, but they are slow and targeted, not a wartime scale of issuance. A central bank that is the buyer of last resort in stress is a different regime from one that funds a 17% deficit in perpetuity.
The constraint is observable, and it is binding now
Both men are right that the constraint is real, and the useful part of their work is that the constraint can be watched rather than forecast. It shows up in the price the market charges the sovereign, and that price has moved.
Every Treasury coupon from 5 years out sits near the top of its own history. The 10yr closed at 5.22% and the 30yr at 5.60% on 8 October, in the 95th and 96th percentiles of their samples. The 2s10s spread is 48.1 basis points. The market is charging the issuer more for the right to borrow longer, which is the fiscal-dominance signal arriving in prices rather than in a projection.
Gold is 4,217.20 and silver 60.565, on 8 October. The hedge is being paid for. The question is not whether debasement is coming; it is which valve the adjustment uses first, and on this evidence it is the yield curve.
Where this breaks
Six tests would move the read. A 30yr yield that falls durably while the deficit is unchanged would show the supply is not binding. A Treasury auction that fails, with neither the Treasury nor the Federal Reserve willing to absorb it, would show the buyer has gone.
A deficit at or above 10% of GDP with the long end unchanged would show the market is not pricing the borrow. A reversal of the coverage ratio — Fed assets rising back above 25% of federal debt — would show the balance sheet is expanding to carry the debt again, which is Lepard’s case in the data.
A dollar that weakens while long yields rise would put the debasement leg back in play. Gold falling below 4,100 with 30yr yields rising would return the hedge to a real-rate trade. On the current prints, none has happened.
A Fifth of Revenue, on Our Own Arithmetic. — Interest against receipts, and why a rate hike does not tighten.
The Buffer Refilled. The Floor Still Leaked. — The same week, from the plumbing: the floor held by agreement, not scarcity.
The Spread Read, the Funds Did Not. — Where the constraint is showing up in credit while the long end holds.