The Bottom Cracks Alone. The Rest Is Treasuries.
A credit spread is the extra yield a lender demands over a government bond to hold corporate risk. When the spread widens, the market is repricing the borrower. When the yield rises but the spread does not, the market is repricing the government bond underneath it. The difference matters, because one is a statement about credit and the other is a statement about the state.
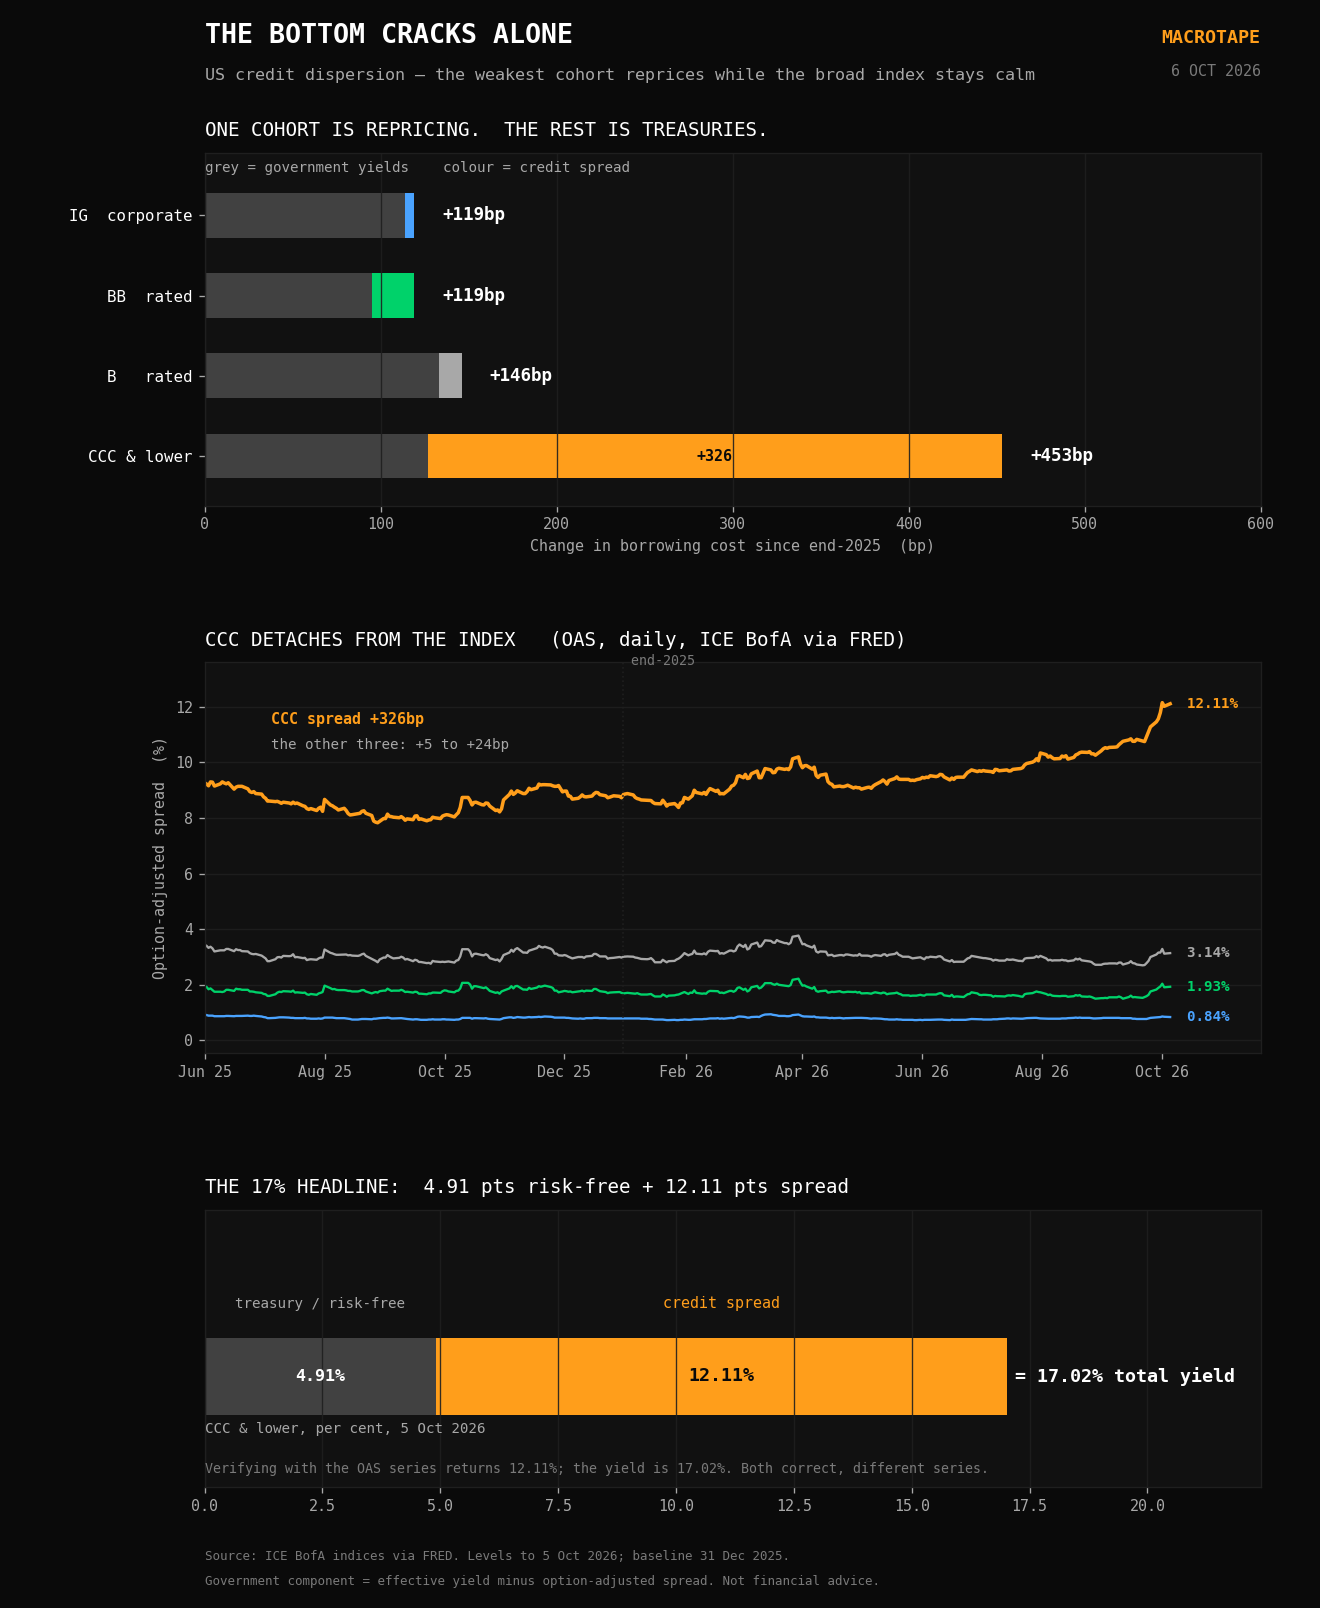
On 5 October the weakest US corporate borrowers, those rated CCC or below, paid an effective yield of 17.02%, per the ICE BofA index. That is up from 12.49% at the end of 2025. It is the highest in the daily record. Read alone it says the credit market is cracking.
The broad high-yield index tells a different story. It yields 8.15%, and its spread over government debt has widened only 31 basis points this year. So the crack is not spreading. It is sitting in one cohort, and the rest of the market is repricing the Treasury underneath it. This piece is about which of the two is actually happening.
The measurement
The distressed end, per ICE BofA indices reproduced from the data on 5 October: CCC and lower corporate bonds yield 17.02% and carry an option-adjusted spread of 12.11%. At the end of 2025 those two figures were 12.49% and 8.85%. The yield is up 453 basis points. The spread is up 326.
The distinction is where most readings of this go wrong. A yield of 17% is not a spread of 17%. Of the 453 basis points of extra cost, 326 came from the market demanding more for credit risk and 127 came from the government curve underneath. Anyone re-checking the 17% against the spread series gets 12.11% and concludes the claim is overstated. Both numbers are correct. They are different series.
The chart below sets the change since end-2025 for four rating buckets, split into the government component and the credit component. One bar looks nothing like the other three.
One cohort, not the market
The other three buckets are quiet on credit and loud on government. Investment-grade corporates yield 6.03%, up 119 basis points this year, of which 5 is spread and 114 is the government component. BB-rated borrowers yield 6.23%, also up 119, of which 24 is spread. Single-B borrowers yield 8.17%, up 146, of which 13 is spread.
In each case the credit spread barely moved. The entire increase in what companies pay is the Treasury curve rising beneath them. That is not a credit event. It is a rates event arriving on corporate income statements.
The broad high-yield index makes the same point from the other side. Its spread is 3.12%, 31 basis points wider than at the end of 2025, and still inside the 4.61% peak it reached in April 2025. For the index as a whole, credit conditions are looser than they were 18 months ago.
So the four bars diverge. CCC carries a genuine credit problem, worth 326 basis points. Everything above it carries a duration problem, worth 114 to 133 basis points. Calling both of them a bond sell-off hitting companies is true but flat. They are different events with different fixes.
The government component is the term premium
The 127 basis points of government cost inside the CCC yield is not abstract. It is the same long-end repricing visible everywhere. The US 10yr yields 5.28% and the 2yr 4.83%, per Treasury data on 2 October. The 10yr term premium, the extra the market charges for lending long rather than short, rose from 0.88% on 31 August to 1.09% on 2 October on the Kim-Wright model, per the data, and from 0.70% at the end of June.
That is why the decomposition matters for the weakest borrowers more than for anyone else. A CCC company has no pricing power to absorb a higher risk-free rate. Every basis point of the government component lands on its interest bill with no offset. The strongest issuers can pass it through or term out. The weakest cannot.
The Federal Reserve sets the short end and the short end is falling. It has no purchase on the long end, where the market prices deficits and term premium. So the policy lever the market expects to help is aimed at the part of the curve that is not causing this.
Bank of America cut its October investment-grade issuance forecast from $160bn to $110bn, per a note reported on 6 October. That is the supply side responding: issuers deferring into a market that will charge them more. It is a postponement, not a cancellation. The borrowing has not gone away, it has moved later.
The post that prompted this, and what it skipped
A post circulating on 6 October, carrying a chart by the Financial Times, put the weakest US companies at around 17% and called it the highest since 2020, with most of the increase coming from spreads. Every number in it checks out. The 17% is the effective yield, the spread-led claim is correct, and the FT chart's own split of roughly 4.4 points of total cost into 3.2 of spread and 1.0 of government reconciles with the index to within a few basis points.
One caveat has to be stated rather than glossed. The daily series available here begins in October 2023, so the "highest since 2020" claim cannot be verified inside it. Contemporary reporting put the March 2020 print near 17.5% at quarter-end. The current level sits at or just below that, which makes the claim fair on the evidence but not provable from the series alone.
Where the post reads past the data is scope. It says the bond sell-off is now hitting companies. The index says the sell-off is hitting the government curve, and only the CCC cohort is being hit on credit as well. The distinction is not pedantic. A spread-led move is a warning about the borrowers and it transmits to defaults. A government-led move is a warning about fiscal policy and it transmits to every borrower equally, the strong and the weak alike.
The honest reading is that the bottom of the market is telling the truth about credit and the rest of the market is telling the truth about the state. Both warnings are live. They are not the same warning.
What makes the bottom different
The CCC cohort cannot refinance its way out of a higher risk-free rate. Investment-grade issuers can extend duration, prepay, or wait. CCC issuers are usually already short-dated and already paying a spread that prices real probability of default. Add 127 basis points of government cost to a borrower with no cushion and the arithmetic turns.
That is why the CCC spread widening is the one part of this that is genuinely about credit. It is the market re-rating the probability of default for companies that cannot absorb the policy mix. The rest of the ladder is not re-rating defaults. It is marking the price of money.
There is an asymmetry to watch. If the long end keeps rising, the government component keeps growing and it is the weakest cohort that breaks first. If the long end stabilises, the CCC spread is the number that matters, and it is the only one currently above its April 2025 level. Either way, the index is the wrong screen. The dispersion is the signal.
The maturity wall
Roughly $1.45tn of US investment-grade debt matures between 2026 and 2030, per Moody's. That debt was issued when the government curve was materially lower. It refinances into a 6.03% investment-grade yield, of which the government component is most of the increase.
For strong companies the wall is an earnings drag, spread over years. For weak companies it is a solvency question, concentrated in the near years. The wall is the mechanism by which a rates event becomes a credit event, and it does so selectively. The strong refinance at a higher cost. The weak are repriced.
This is the piece of the story with the longest fuse. The CCC spread is the punctual signal. The wall is the transmission.
The invalidation
This read is wrong if the CCC spread compresses back toward its end-2025 level of 8.85% while the government component stays elevated, which would say the bottom cohort was repricing a temporary liquidity squeeze rather than default risk. It is wrong if the broad high-yield spread widens through its April 2025 peak of 4.61%, which would say the move is spreading and the dispersion framing is too narrow. And it is wrong if the government component falls back toward zero across all four buckets, which would say the long end repriced and then un-repriced, leaving both warnings inoperative.
Four Facts the Market Has Not Priced — the absorption and plumbing readings behind the same long-end repricing
The Same Three Exits. The Valve Is Where They Differ. — where the fiscal pressure goes when the spread and the currency are both spoken for
The Spread Inverted. Greece Now Borrows Cheaper Than France. — the same split, sovereign rather than corporate: a widening spread inside a calm surface